The HubSpot sales dashboard will show you everything you need to gain complete visibility into your sales process. This is where you can organize various reports and create a visual representation of your entire marketing and sales funnel. Discover what a HubSpot dashboard is, some of the top HubSpot Sales dashboards to use, and how to create one.
What is a HubSpot Sales Dashboard?
HubSpot sales dashboards are visual representations of the related data you are collecting. They contain relevant key performance indicators (KPIs) such as deal pipelines, deal forecasting, sales activity, and much more.
HubSpot allows you to create up to 300 different dashboards to share within your organization. You can use the existing reports that come standard with HubSpot or generate custom reports relevant to the KPIs you want to track. This information can be used to track progress toward existing sales goals and create new plans based on historical data.
How To Create a Dashboard in HubSpot
Creating a HubSpot dashboard is easy. Just follow the steps:
- In the top navigation bar, select Reports > Dashboards
- In the top right corner, click on the “create dashboard” button
- Select a pre-made dashboard or create a blank dashboard to customize later on
- Name your dashboard
- Set user access. You can make your dashboard private, public, or available to specific teams or users.
- Click “create dashboard.”
- Start adding and customizing reports to your dashboard
If you’re just getting started with HubSpot, it may be worth having an expert help set up your dashboards to get recommendations and insights for your specific needs.
5 HubSpot Sales Dashboard Examples to Increase Your Revenue
Here are some examples of effective HubSpot sales dashboards for you to use when analyzing your sales data.
1. Sales Pipeline & Funnel
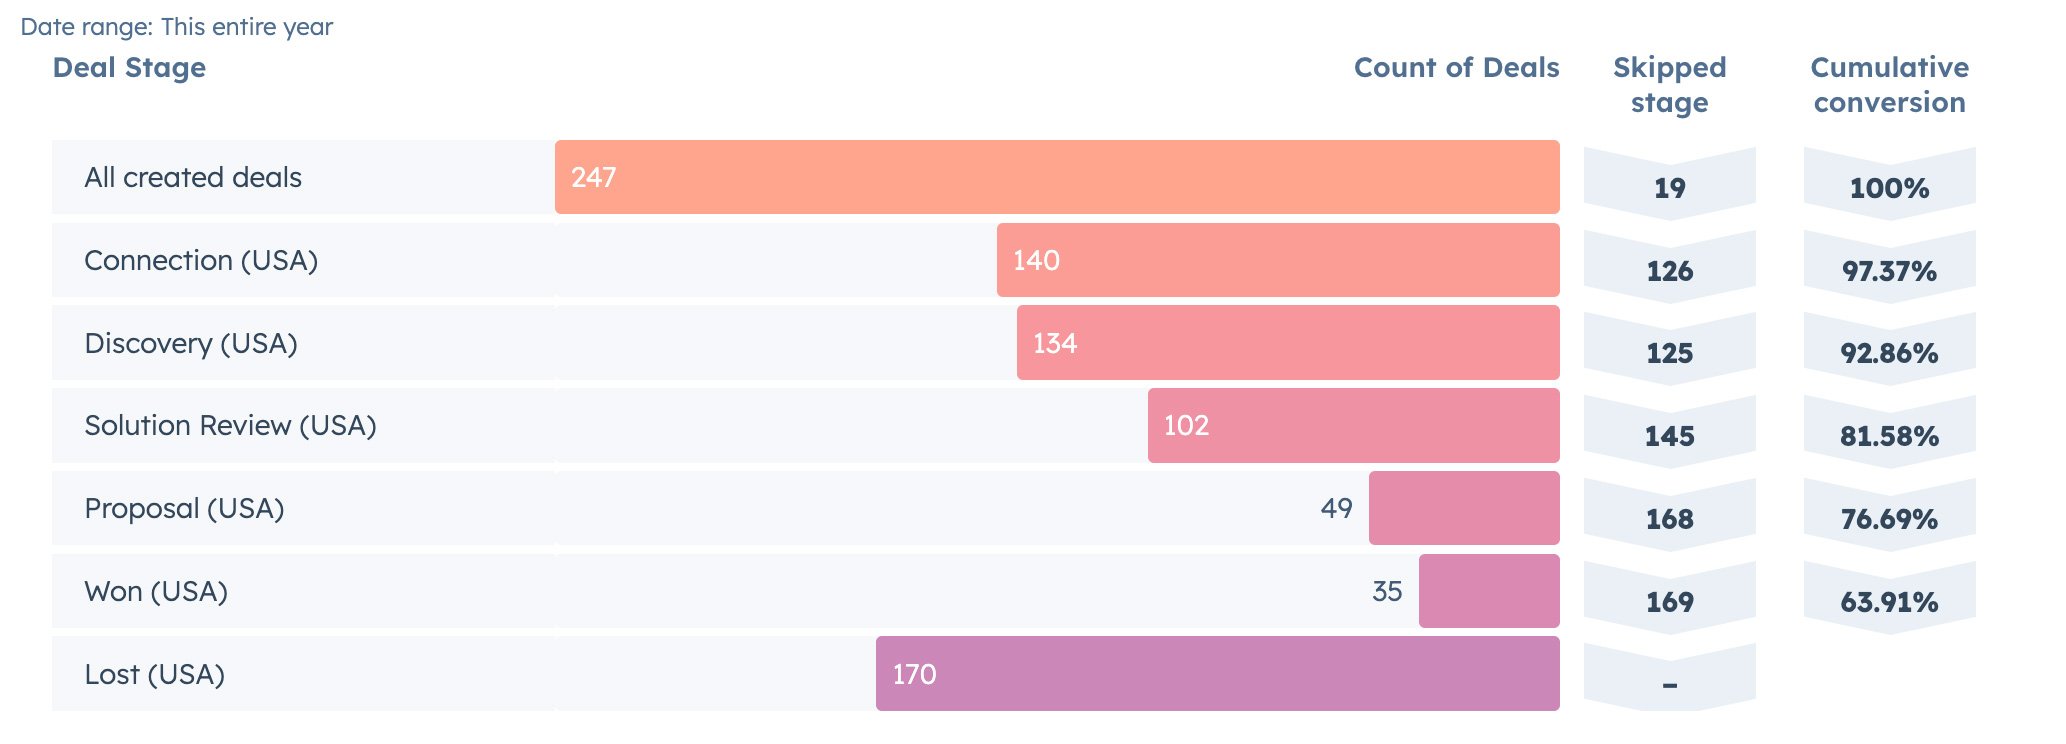
Curious about your company’s conversion rates? This sales pipeline and funnel report is the perfect addition to your HubSpot sales dashboard for helping you keep a bird’s-eye view. It lets you know how many active deals you have in the works, how likely they are to close, and how much revenue is in the pipeline can help create some predictability.
If you have Sales Pro, this report will be auto-generated for you. From the navigation bar in HubSpot, select “Sales” and then “Sales Analytics” from the dropdown menu. Once in that view, Toggle to “Forecasts and Pipelines” in the left sidebar, and select “Deal Funnel.”
2. Average Deal Size
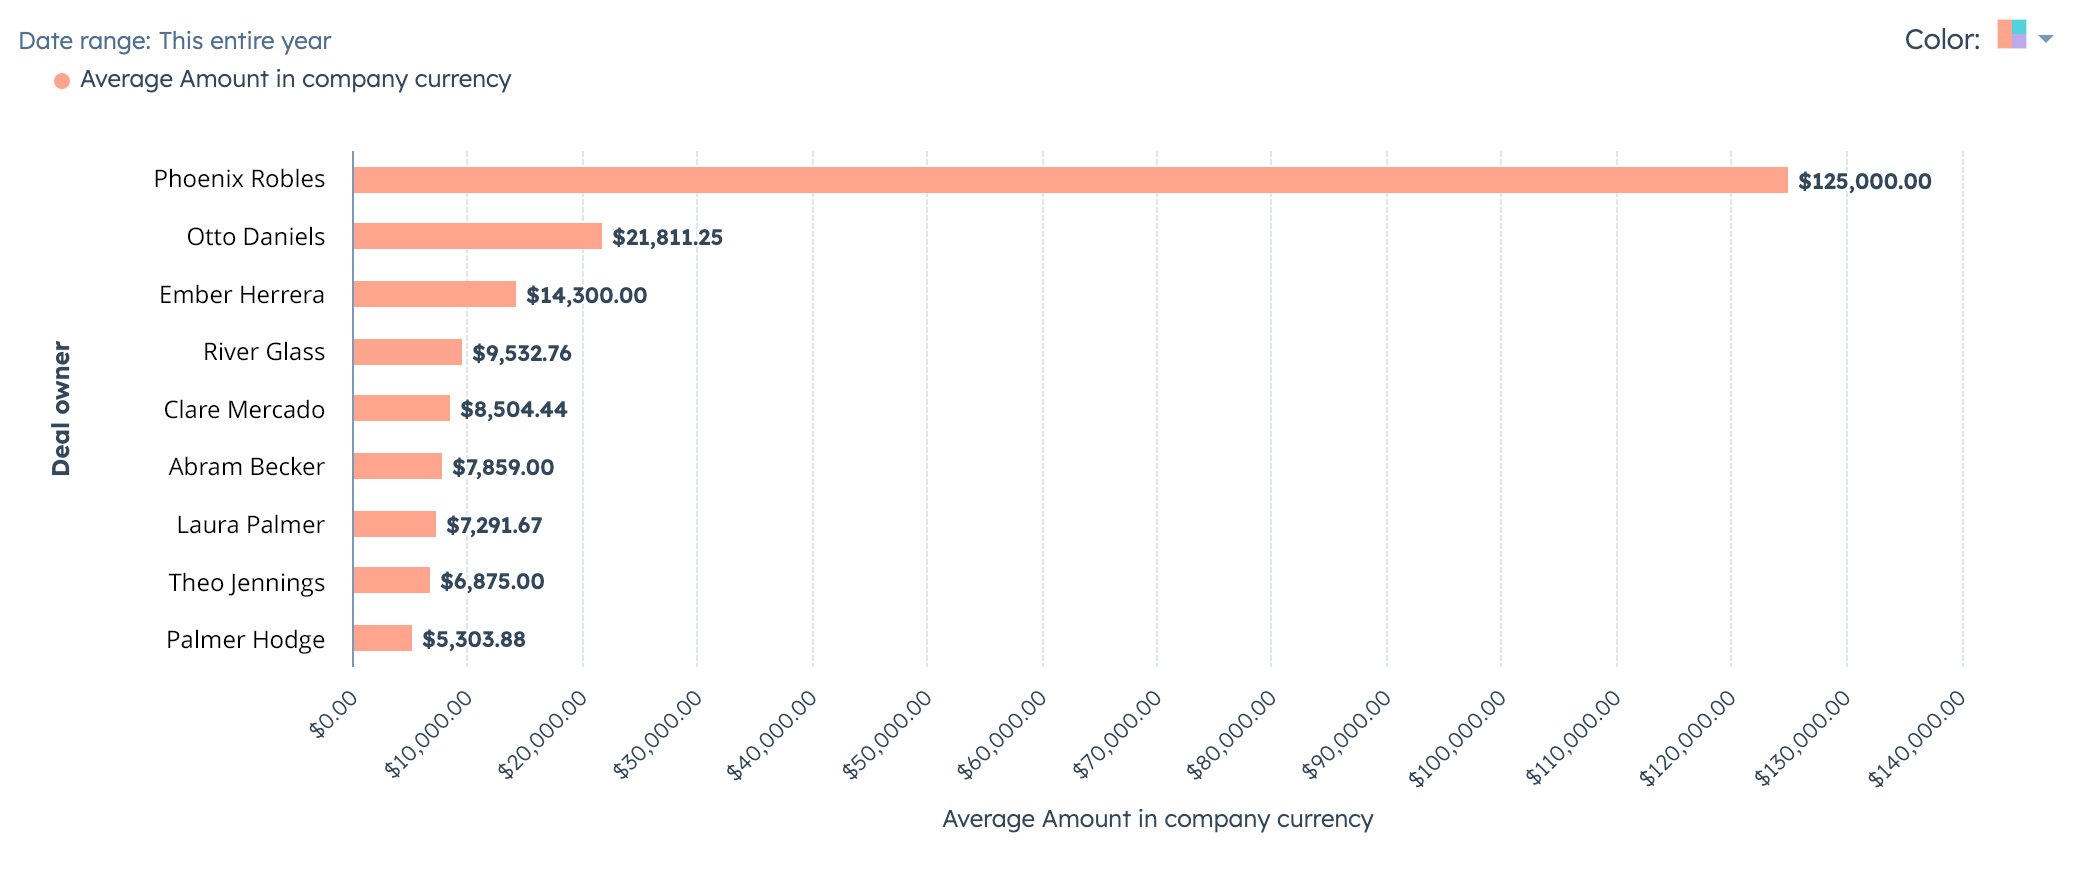
See how each sales representative performs with the average deal size report. This is helpful for sales teams that earn commissions and can help you see who the highest-selling rep is and create healthy competition between team members. You can also use this report to see the average deal size of your pipeline overall.
To create an average deal size report, go to the Sales Analytics view on your HubSpot dashboard. From there, select “Sales Outcomes'' and then “Average Deal Size.” On the right, you can then filter by none or by reps, depending on the data you’re looking for.
3. Activity Leaderboard
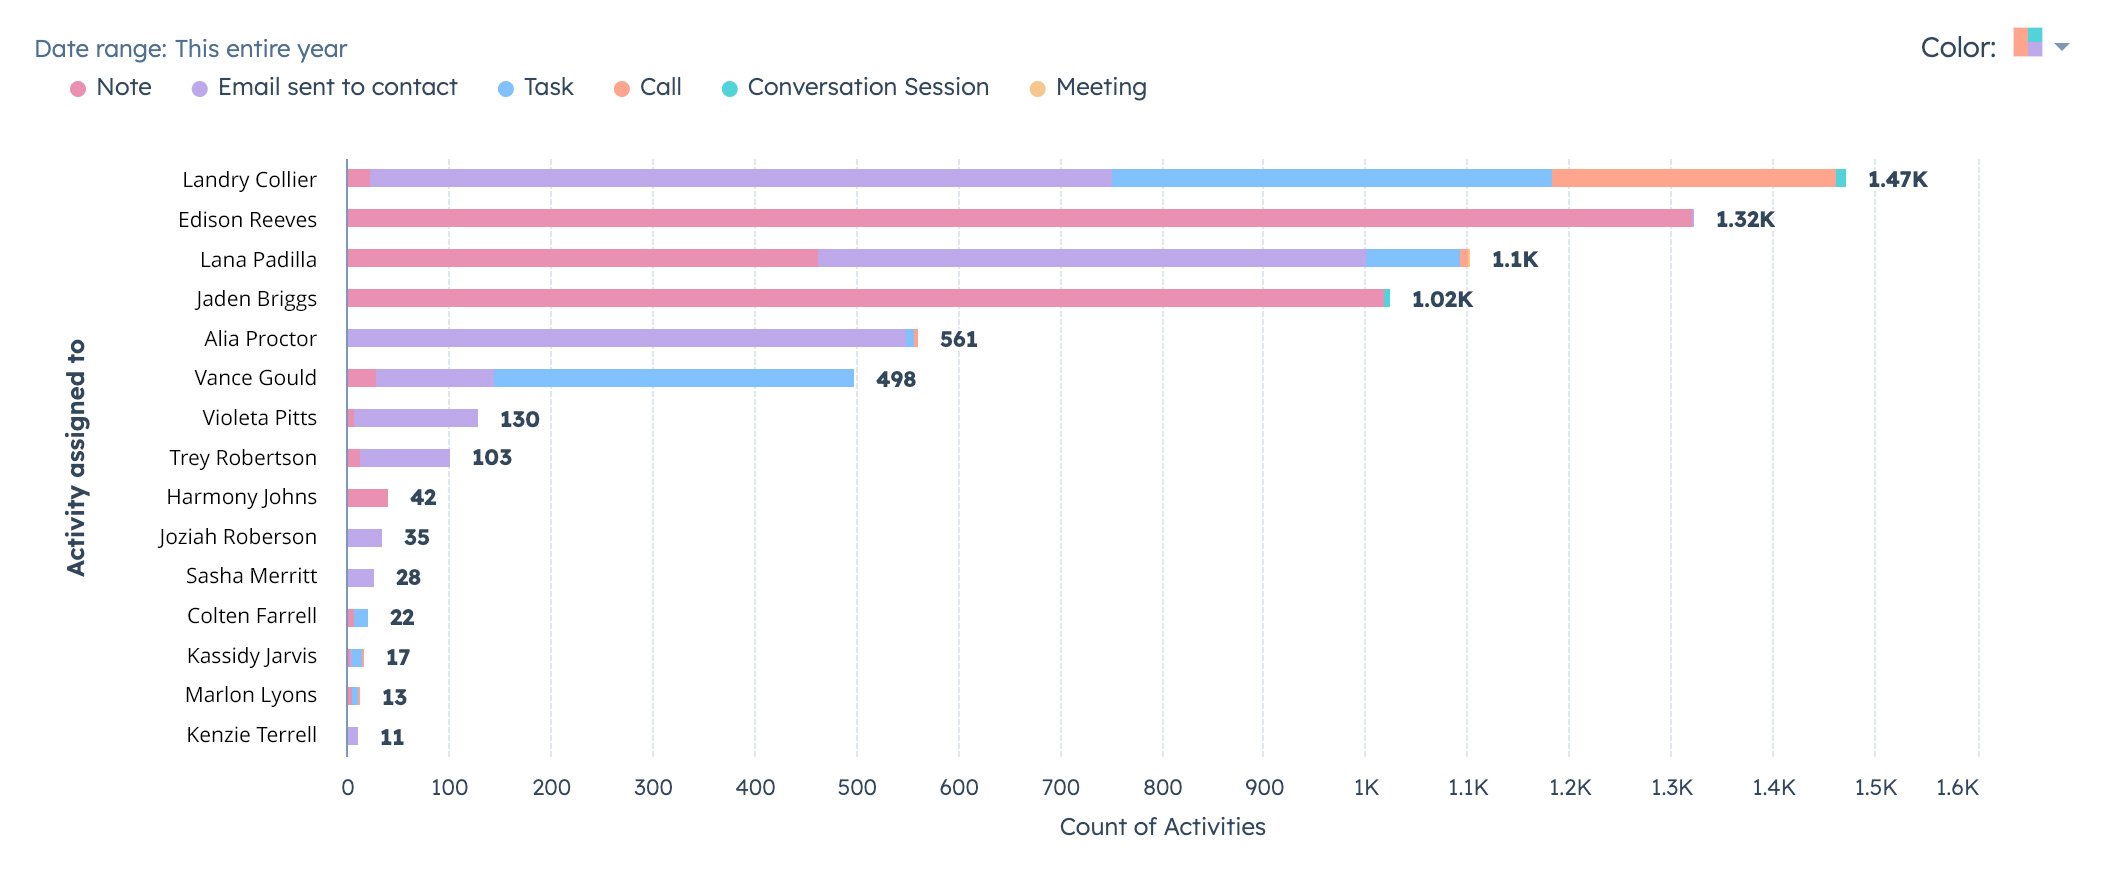
Track productivity with the activity leaderboard report. This report shows how sales reps are using HubSpot and what sorts of activities they tend to complete, such as making phone calls or sending emails. You can filter this data on a daily, weekly, or monthly basis. You can use this data to better understand where your team spends their time and set realistic goals.
Like the other reports, you can make the activity leaderboard report by going into the Sales Analytics view. Select “Coach Reps and Teams'' and then “Completed Activities” to view your data.
4. Deals by Original Source & Deals by Industry
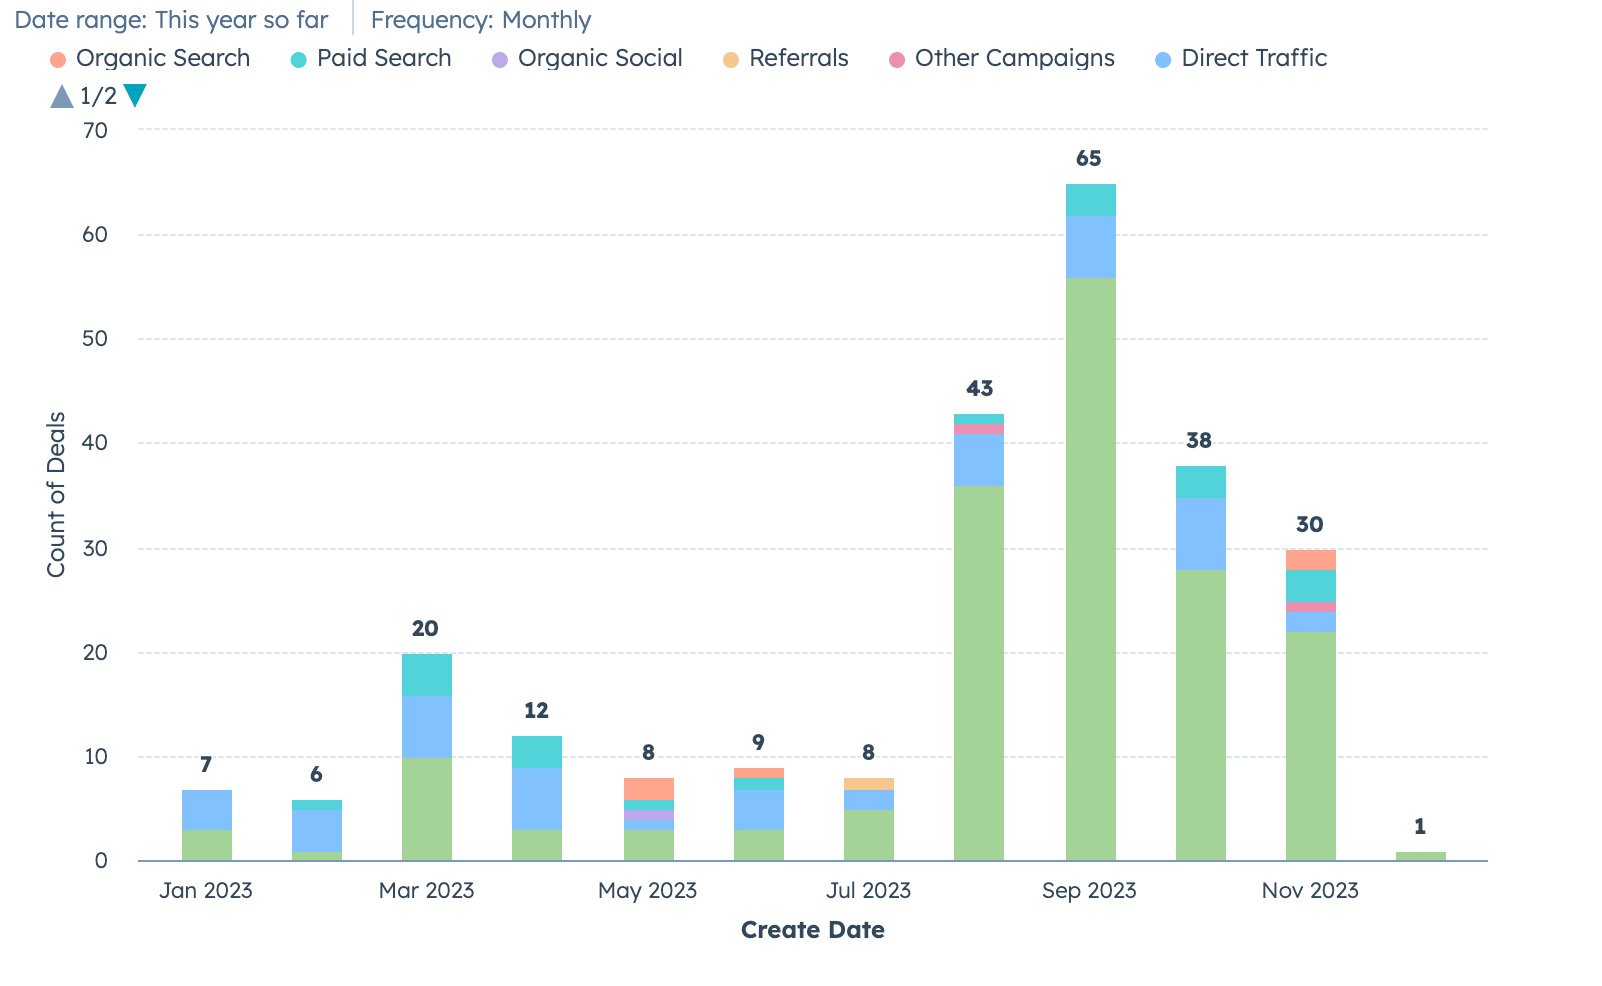
Discover what areas you’re having the most success with when using the deals by original source or deals by industry dashboard. Here you can identify if your searches are mostly coming from paid traffic or organically. By seeing what industry is most popular, you can better tailor your messages and update your persona for a more effective Go-To-Market Strategy.
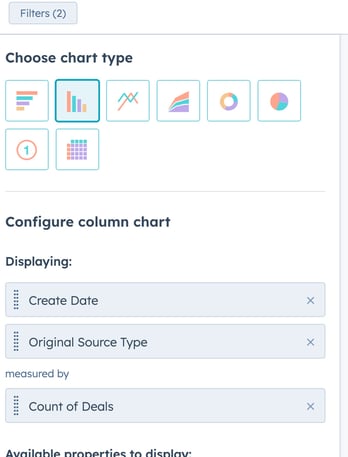
To create this report, go to the “Reporting” section in the navigation bar and click “Create report.” Select “Single object” and then choose “Deals.” Then add “Original Source Type” and “Close Date” to the selected properties. Select “Stacked” as a display option.
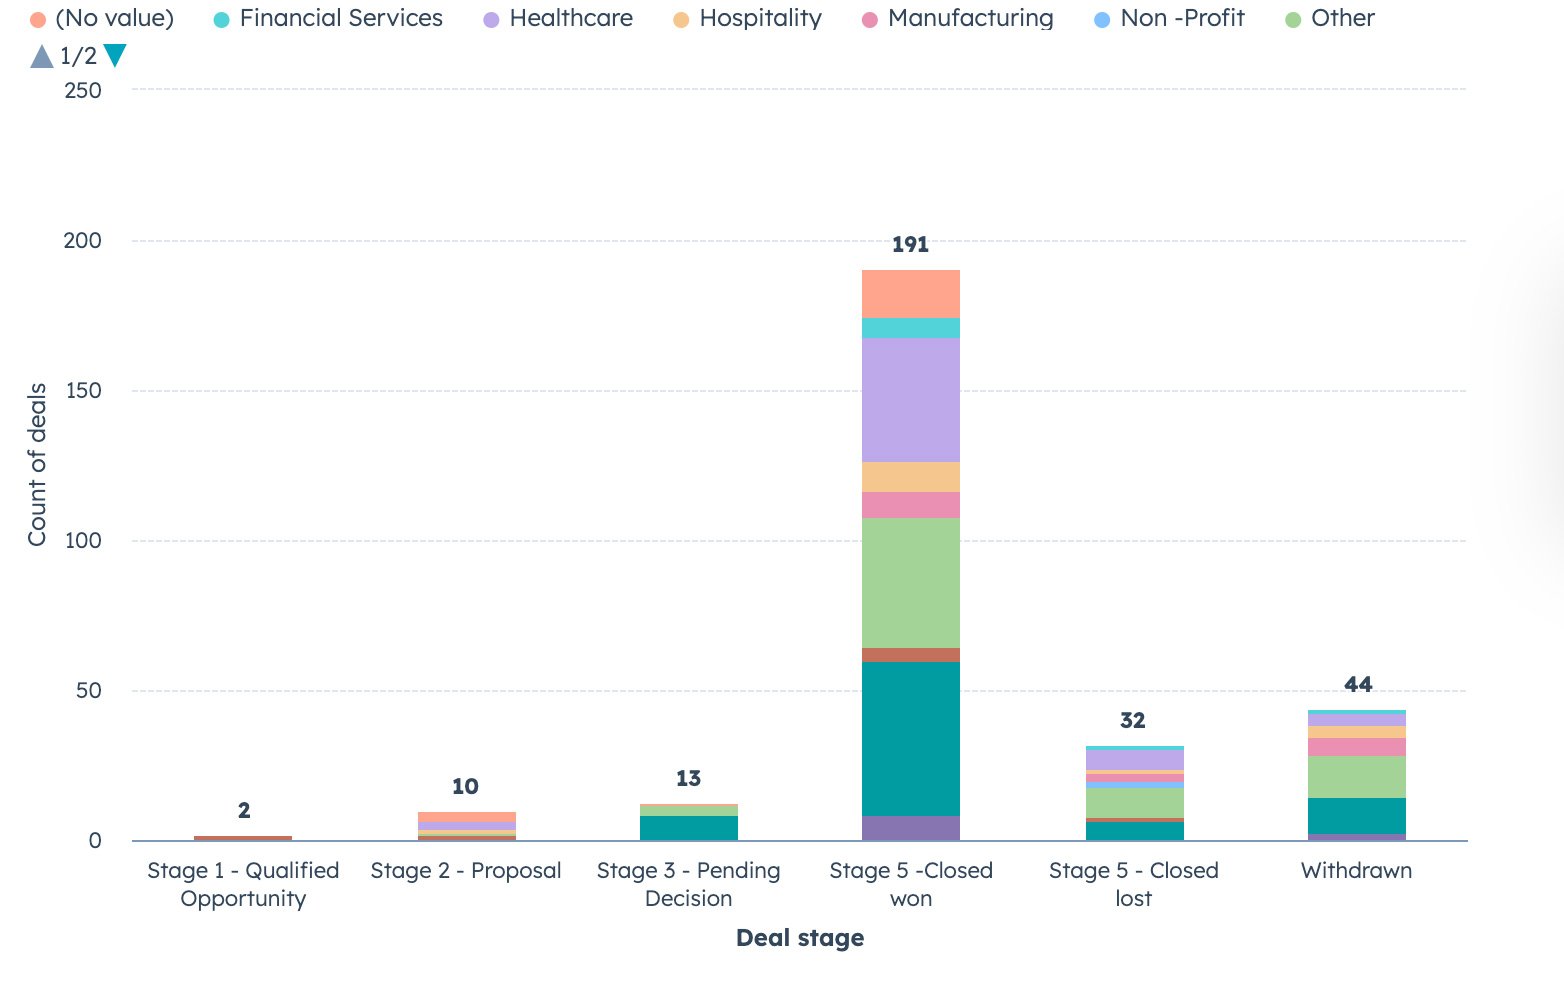
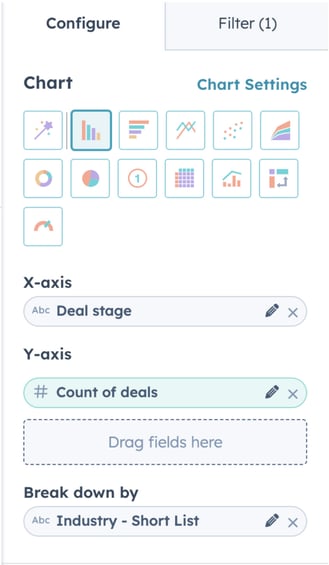
To create Deals by Company industry, create a custom report with both deals and companies as the objects in the “Custom Report Builder” section.
5. Forecast Report
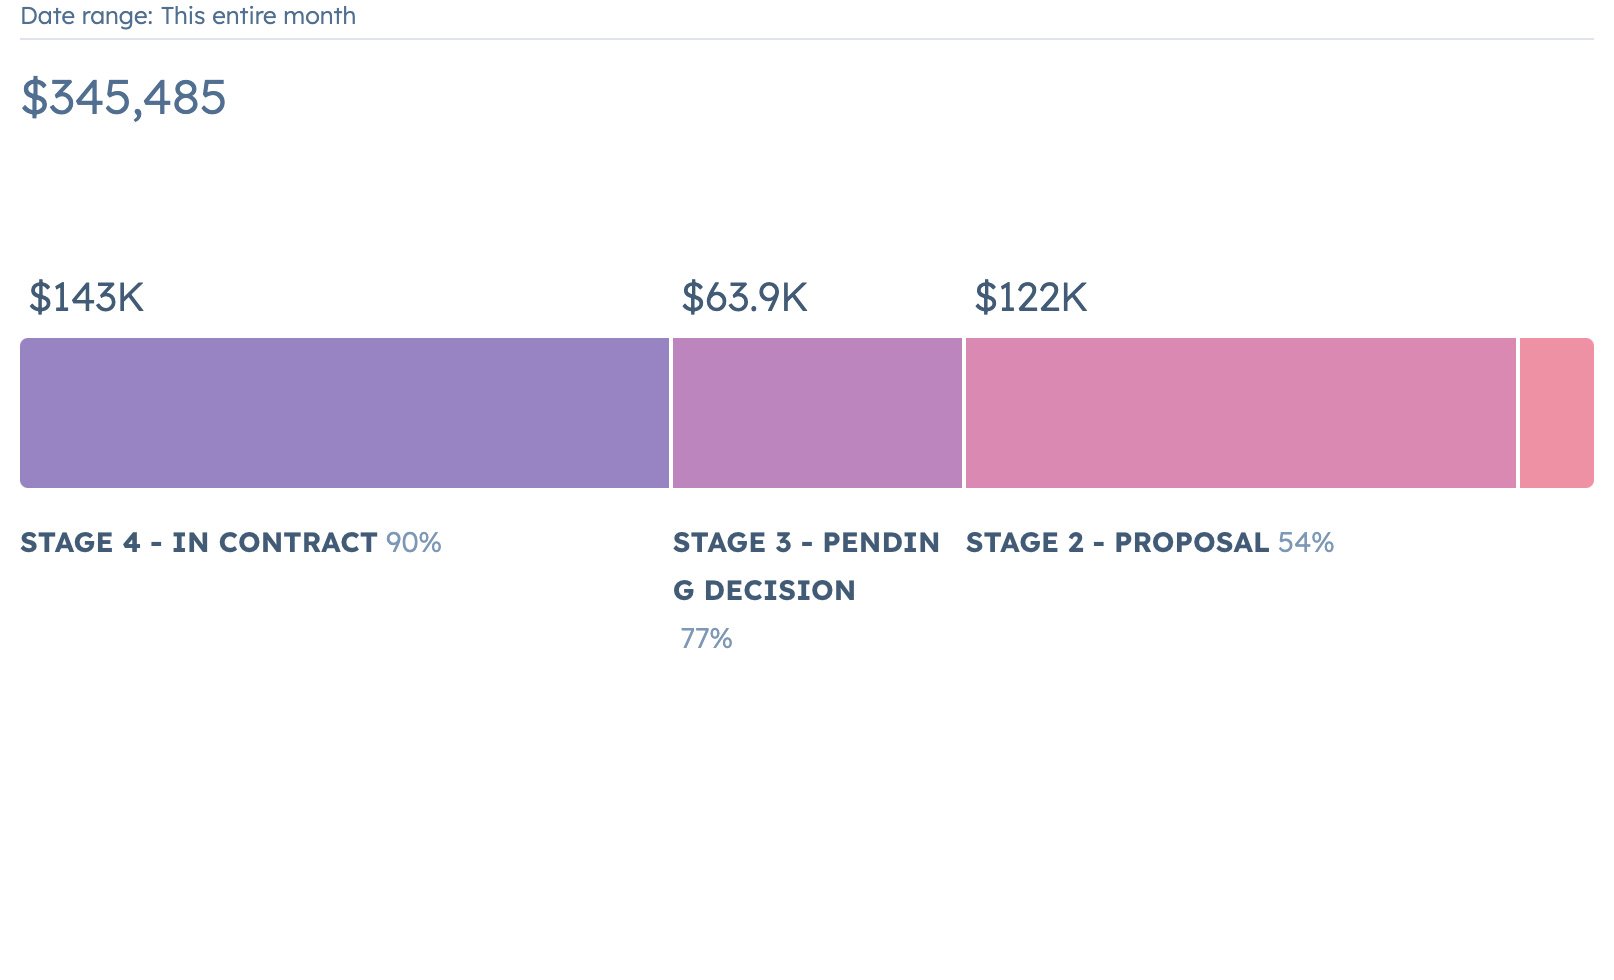
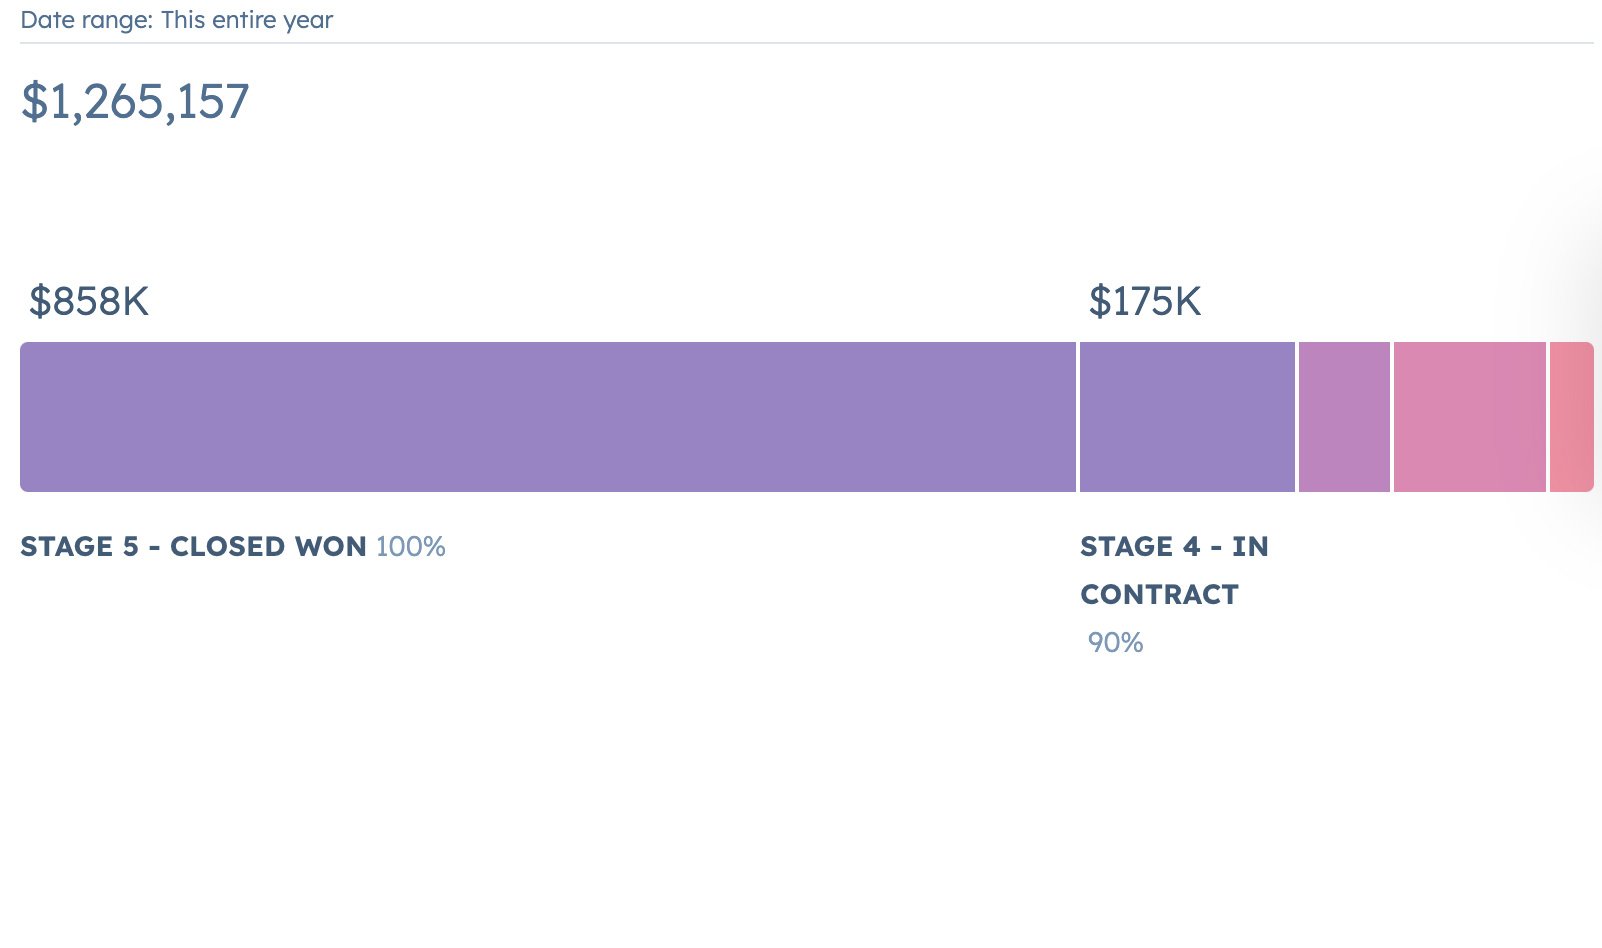
Gauge how much you think your company will make based on the estimated probability of closing a sale in each deal stage. The default forecast report takes deal probability into account and looks at your pipeline to predict how much you will make, providing you insight into what will likely close within the next month, quarter, and year.
Every deal stage in your pipeline has a “win probability” percentage that you can edit in Settings > Objects > Deals > Pipelines. For example, a stage near the end of your sales process like “Contract Sent” might have a win probability of 90%, while a stage near the beginning of your process like “Appointment Scheduled” might have a lower probability of 10%. The weighted pipeline forecast report then takes each deal’s amount and multiplies it by the win probability of the deal stage the deal is in.
Improve Your Sales Process With Insightful Dashboards
Need help navigating your HubSpot sales dashboards? Our free HubSpot Onboarding Checklist guides you on vital steps to take when setting up your account. Download our guide or contact us today for help determining which sales dashboards would help you the most.
Editor’s note: This post was originally published in March of 2023 and has been updated for accuracy and comprehensiveness.

.jpg)


.jpg)